Financial Management and Analysis : TCS and Infosys
Sep 24,21Financial Management and Analysis : TCS and Infosys
Question:
Describe About the Financial Management and Analysis of TCS and Infosys Company?
Answer:
Introduction
The current task has been assigned to the technological industry. The two major international IT firms have been selected. TCS and Infosys are the selected companies for attaining this paper. For conducting the financial performance analysis of the company, financial years 2019 and 2020 is examined with the help of available data.
1.0 Company Profile
TCS is ranked third, while Infosys is ranked fourth in most-valued IT services firms globally. TCS is performing effectively in the world market with a growth of 11% increase in the brand value to reach $15 billion. As per the report, TCS has experienced excellent revenue growth in the demand of the company for its core transformation services expands, as well as landing contracts worth more than $6.8 billion in the 4th quarter of 2020 (TechGig Bureau, 2021). As a result, the company is able to expand its business in the financial sector of EU countries and the US.
On the other hand, Infosys’ brand value is $7.1 billion in the financial year 2020. It was $6.5 billion in the financial year 2019 (Kajarekar, 2021). TCS’s revenues increased by only 0.4 percent year over year, whereas Infosys’ increased by 6.6 percent. Furthermore, Infosys’ trailing 12-month profit increased by 21.2 percent, compared to only 7.1 percent for TCS (Philipose, 2021). Both companies’ profits have had increased by around 3% in the preceding fiscal year. Infosys announced that the TCV (total contract value) of large deals signed in Q3 was at $7.1 billion. This only applies to transactions worth more than $50 million. TCS, on the other hand, had a lower TCV of $6.8 billion across all deals (big and small) (Philipose, 2021). Additionally, because Infosys is only three-fifths the size of TCS, it has greater growth potential.
Financial Performance Analysis of Both Companies
Financial Performance of TCS
Below presented tables are helped to conduct the financial performance of the TCS company.
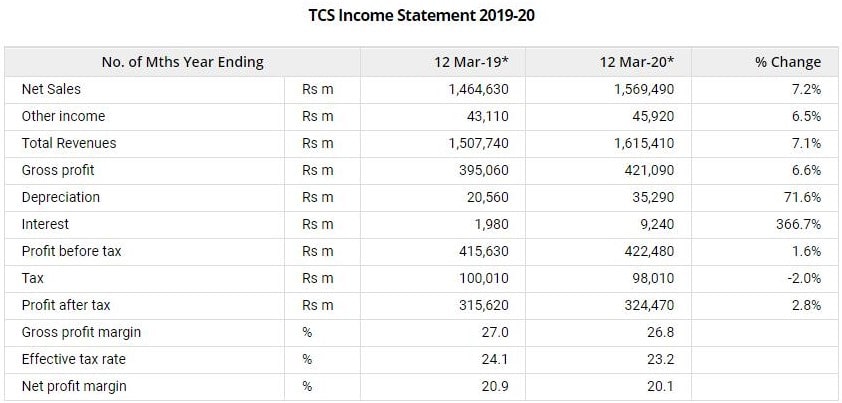
Table 1: Income Statement of TCS
(Source: EquityMaster, 2021)
As per the analysis of the balance sheet of the company, it can be stated that the operating income of the company during FY20 rose7.2%. There is also a 6.6% growth in operating profits of the company. Net profits of the company grew by 2.8% while profit margins increased from 20.9 (FY19) to20.1% in FY20.
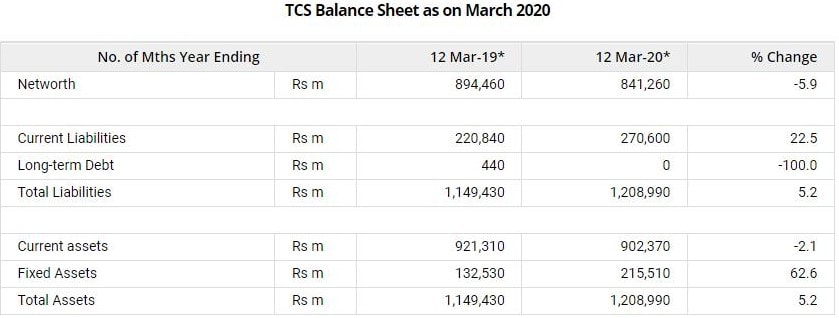
Table 2: Balance Sheet of TCS
(Source: EquityMaster, 2021)
The liabilities of the company from the above figure are reduced from Rs 221 billion in the financial year 2019 to Rs 271 billion. Assets of the company were fallen by 2%
Ratio Analysis for TCS
Solvency Ratios
Current Ratio: During FY19, the current ratio of the company was 4.2x which is 3.3x during the financial year 2020. It means the company has the ability to pay its long-term and short-term obligations.
Interest Coverage Ratio: This ratio of the company has declined. During 2019, it was 210.9x that was reach 46.7x during the financial year 2020.
Profitability Ratios
Followings are the elements of profitability ratio of the company:
Return on Equity (ROE): This ratio improved from 35.3% in the financial year 2019 to 38.6% in the financial year 2020. It means the company is also able to generate profits from the use of shareholder’s capital.
Return on Capital Employed (ROCE): This ratio of the company is improved and reached 51.3% in the financial year 2020. It was 46.7% in the end financial year of 2019. As per this analysis, the company is generating profits from its total capital employed by the company to operate its business.
Return on Assets (ROA): This ratio of the company is declined by 27.6% during FY20. It was at 27.6% in the financial year FY19. It means the company is effectively managing the earning by the assets.
Key Ratio Analysis
| No. of Mths Year Ending | 12 Mar-19* | 12 Mar-20* | |
| Current ratio | x | 4.2 | 3.3 |
| Debtors’ Days | Days | 68 | 71 |
| Interest coverage | x | 210.9 | 46.7 |
| Debt to equity ratio | x | 0.0 | 0.0 |
| Return on assets | % | 27.6 | 27.6 |
| Return on equity | % | 35.3 | 38.6 |
| Return on capital employed | % | 46.7 | 51.3 |
Table 3: Key Ratio Analysis for TCS
(Source: EquityMaster, 2021)
Financial analysis of Infosys
As per the below-presented table, it can be stated that the operating income of the company rose by 9.8% during 2020. The operating profit of the company was also increased by 10.4%.
INFOSYS Income Statement 2019-20
| No. of Mths Year Ending | 12 Mar-19* | 12 Mar-20* | % Change | |
| Net Sales | Rs m | 826,750 | 907,910 | 9.8% |
| Other income | Rs m | 28,820 | 28,030 | -2.7% |
| Total Revenues | Rs m | 855,570 | 935,940 | 9.4% |
| Gross profit | Rs m | 201,700 | 222,670 | 10.4% |
| Depreciation | Rs m | 20,110 | 28,930 | 43.9% |
| Interest | Rs m | 0 | 1,700 | 0.0% |
| Profit before tax | Rs m | 210,410 | 220,070 | 4.6% |
| Tax | Rs m | 56,310 | 53,680 | -4.7% |
| Profit after tax | Rs m | 154,100 | 166,390 | 8.0% |
| Gross profit margin | % | 24.4 | 24.5 | |
| Effective tax rate | % | 26.8 | 24.4 | |
| Net profit margin | % | 18.0 | 17.8 | |
Table 4: Income Statement of Infosys
(Source: EquityMaster, 2021)
Balance Sheet Analysis
From the below-presented table, it can be stated that the current liabilities of the company during the financial year 2020 are Rs 209 billion that was 186 billion in 2019. The increase in liabilities was 11.9%. There was a 3% growth in the current assets of the company and a 45% increment in the fixed assets of the company in 2020.
INFOSYS Balance Sheet as on March 2020
| No. of Mths Year Ending | 12 Mar-19* | 12 Mar-20* | % Change | |
| Networth | Rs m | 649,480 | 654,500 | 0.8 |
| Current Liabilities | Rs m | 186,380 | 208,560 | 11.9 |
| Long-term Debt | Rs m | 0 | 0 | 0.0 |
| Total Liabilities | Rs m | 847,380 | 927,680 | 9.5 |
| Current assets | Rs m | 528,780 | 545,760 | 3.2 |
| Fixed Assets | Rs m | 170,980 | 247,430 | 44.7 |
| Total Assets | Rs m | 847,380 | 927,680 | 9.5 |
Table 4: Balance Sheet of Infosys
(Source: EquityMaster, 2021)
Ratio Analysis for INFOSYS
Solvency Ratios
Current Ratio: This ratio was 2.6x during 2020 that was 2.8x during 2019. It means the ability to pay long-term and short-term obligations of the company have increased.
Interest Coverage Ratio: this ratio is improved from 0.0x to 130.5x during financial year 2020. It means the ability of the company to pay interest on the debt is high.
Profitability Ratios
Return on Equity (ROE): for the company, ROE improved and reached at 25.4% in the financial year of 2020. It was at 23.7% in the year of FY20. From this analysis, it can be stated that the company has ability to gain profits from the use of shareholders capital.
Return on Capital Employed (ROCE): For the company, ROCE improved and reached at 33.9% in the year of 2020. It was at 32.4% during 20219. It means company is generating profits from its employed capital in the company.
Return on Assets (ROA): For the company, ROA declined and reached 18.1% in the financial year 2020. It was 18.2% during 2019. It means the ability to earn profits from assets is affected.
Key Ratio Analysis
| No. of Mths Year Ending | 12 Mar-19* | 12 Mar-20* | |
| Current ratio | x | 2.8 | 2.6 |
| Debtors’ Days | Days | 65 | 74 |
| Interest coverage | x | 0.0 | 130.5 |
| Debt to equity ratio | x | 0.0 | 0.0 |
| Return on assets | % | 18.2 | 18.1 |
| Return on equity | % | 23.7 | 25.4 |
| Return on capital employed | % | 32.4 | 33.9 |
Table 6: Key Ratio of Infosys
(Source: EquityMaster, 2021)
Comparison between Financial Performance of Both companies
As per the below-presented figure, it can be described that the revenue growth and operating profit growth of Infosys are higher than TCS in the financial year of 2021 in the comparison of the performance of both companies in the financial year of 2020. This can be a result of the pandemic that affected the performance of the TCS in the comparison of Infosys.
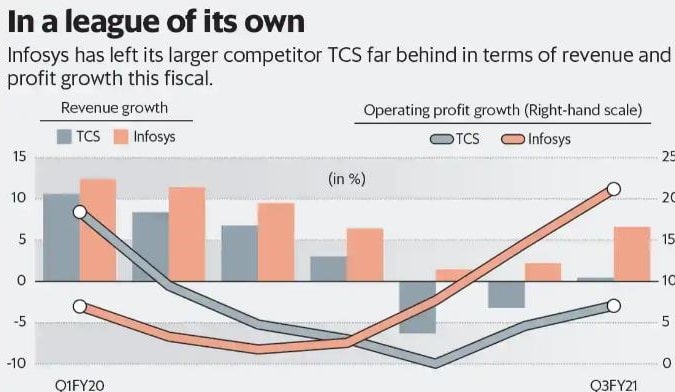
Figure 1: Comparative Analysis of TCS and Infosys
(Source: Philipose, 2021)
Conclusion
Infosys and TCS are two of the world’s largest IT firms. In the context of the IT sector, the two companies have a significant market share in the world market. When comparing the financial performance of TCS and Infosys for the years 2020 and 2019, it can be seen that TCS outperformed Infosys in 2019 while the situation was reversed in 2020. TCS’ profitability has been reduced from Infosys in the financial year 2020. As a result, the investors’ earnings have increased. However, Infosys’ profit margin has increased. The company’s ability to keep its short-term assets is questionable. The corporation is not making the best use of its short-term obligations. As a result, the company’s liquidity ratios are strong.
References
equitymaster (2021). INFOSYS 2019-20 Annual Report Analysis. Retrieved from https://www.equitymaster.com/research-it/annual-results-analysis/INFY/INFOSYS-2019-20-Annual-Report-Analysis/835
EquityMaster (2021). TCS 2019-20 Annual Report Analysis. Retrieved from https://www.equitymaster.com/research-it/annual-results-analysis/TCS/TCS-2019-20-Annual-Report-Analysis/836
Kajarekar, R. (2021). TCS Fails To Beat IBM, Accenture, Is Now #3 Most Valued IT Firm; Infosys Beats Cognizant For #5 Spot. Retrieved from https://trak.in/tags/business/2021/01/28/tcs-fails-to-beat-ibm-accenture-is-now-3-most-valued-it-firm-infosys-beats-cognizant-for-5-spot/
Philipose, M. (2021). Infosys is a sweet spot ass it races past TCS on profits growth in FY21. Retrieved from https://www.livemint.com/market/mark-to-market/infosys-is-in-a-sweet-spot-races-past-tcs-on-profit-growth-in-fy21-11610548415386.html
TechGig Bureau (2021). TCS and Infosys become the 3rd and 4th most-valued IT services firms globally. Retrieved from https://content.techgig.com/tcs-and-infosys-become-the-3rd-and-4th-most-valued-it-services-firms-globally/articleshow/80513663.cms